Designed to be viewed on a desktop PC or tablet the Shark ESMS Managers Dashboards are structured to give an overview of compliance at all levels of the business.
The users login will taken them straight to the dashboard level relevant to them.
⤵️
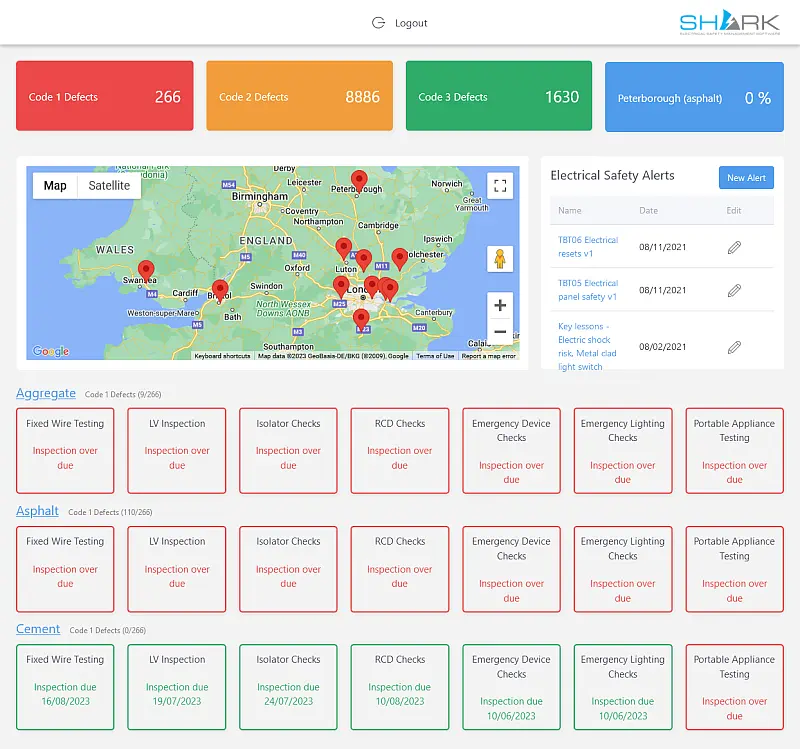
Company wide Dashboard
The top level login shows information for the entire company with:
- Number of Defects by type for all sites.
- Site with the lowest compliance score according to the companies criteria
- Site locations
- Electrical Safety Alerts
- Last and due inspection dates by business sector.
Selecting a business sector e.g. Aggregate, Asphalt or Cement, goes down a level to the sector dashboard e.g Aggregate, Asphalt or Cement.
Select the tabs ↑ Sector Region Site to view other dashboards.
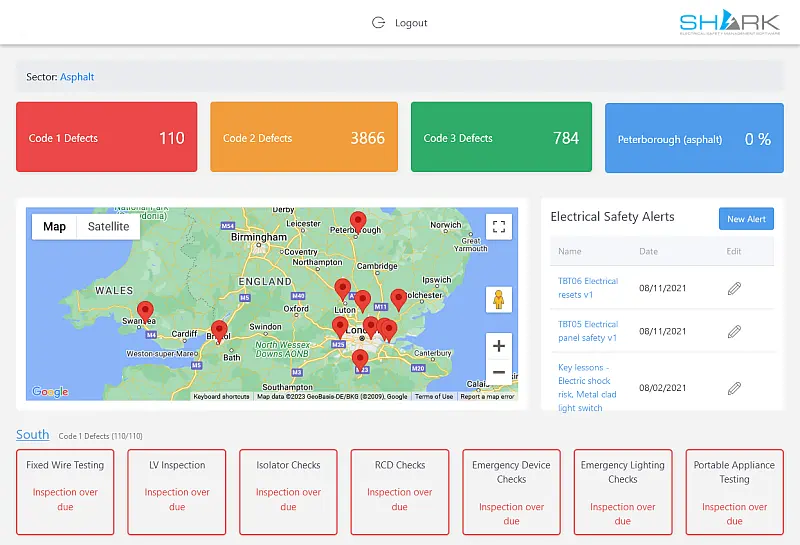
Sector Dashboard
Showing the same information as the business overview only for the selected Sector
- Number of Defects by type for the specific sector
- Site in the sector with the lowest compliance score according to the companies criteria
- Site locations
- Electrical Safety Alerts
- Last and due inspection dates by business sector.
Selecting a region sector e.g. South, goes down a level to a list of site dashboards.
Select the tabs ↑ Company Region Site to view other dashboards.
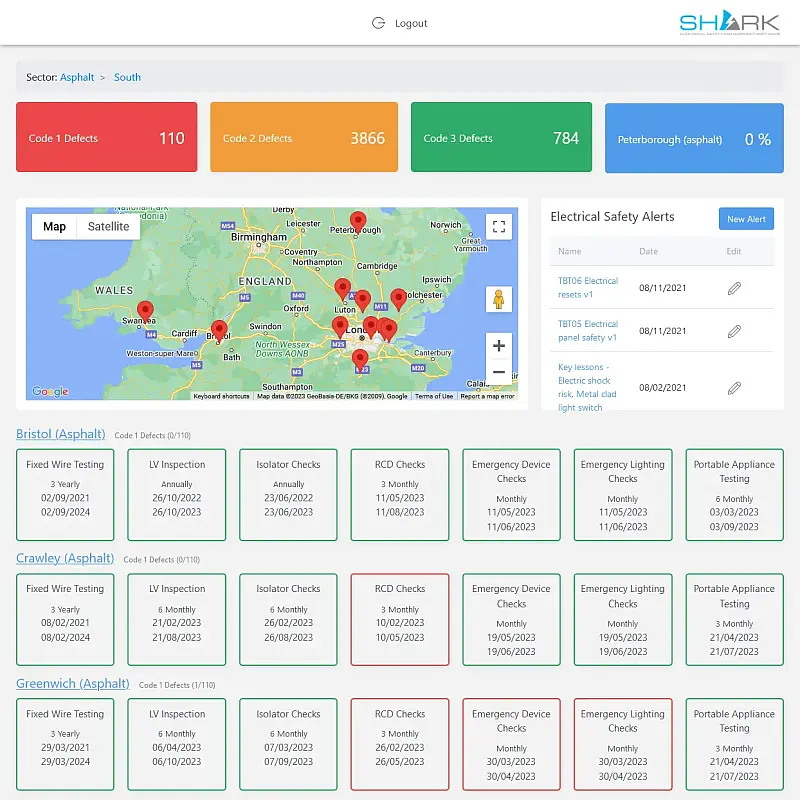
Regional Dashboard
With a similar information as the business and sector dashboards listing the sites in the selected region
- Number of Defects by type within the region
- Sitein the region with the lowest compliance score according to the companies criteria
- Site locations
- Electrical Safety Alerts
- Last and due inspection dates by business sector.
Selecting a site will go to the day to day dashboard used by the site manager or other designated persons.
Select the tabs ↑ Company Sector Site to view other dashboards.


Site Dashboard
This is the dashboard that most manager will use on a regular basis
- Number of Defects by type for the site
- The sites compliance score according to the companies criteria
- Site locations
- Electrical Safety Alerts
- Last and due inspection dates by business sector.
- Site Documents
Continue for detailed information about the site Dashboard.
Select the tabs ↑ Company Sector Region to view other dashboards.
For all types of dashboard:
The row of defect code numbers at the top is colour coded

Red: Code 1 Defects
Orange: Code 2 Defects
Green: Code 3 Defects
Blue: Compliance Score
Each box in the row of inspection types is colour coded with a traffic light system is used to show overall inspection status and for multiple sites will show the worst case scenarios.

Red: Overdue
Orange: Due within 7 Days
Green: Due > 1 week
🔝


